Nationwide shortages of special education teachers continue to affect schools across the country and in Nebraska. When teachers leave their districts, they take their expertise and the relationships they have built with students and families. This results in a loss that goes far beyond what financial figures can capture. The departure of these educators can significantly impact student growth and achievement.
In Nebraska, there are two data-based decision-making tools to address teacher retention and vacancies: the Statewide Special Education Retention Data System and the Nebraska Teacher Vacancy Report. These resources provide districts with valuable data for making informed decisions. Each report offers schools a wealth of information about the current state of teacher retention and vacancies throughout the state.
DATA SOURCES
STATEWIDE SPECIAL EDUCATION RETENTION DATA SYSTEM
The Nebraska special education retention data collection system (SRDS) has created a comprehensive picture of special education teacher retention. Much like a landscape, the retention data includes various important focal points. The Get SET Nebraska team used the information collected through the data collection system to provide a complete narrative about retention in Nebraska, focusing on the following key aspects:
- Statewide Retention and Acceptable Thresholds
- Retention by Region
- Retention by Educational Service Unit (ESU) Service Area
- Retention by Position and Time in Service
- Reasons Teachers are not Retained
DATA SYSTEM INFORMATION
The statewide special education retention data system was established through a collaboration between the UNL’s Nebraska Center for Research on Children, Youth, Families and Schools (CYFS), Nebraska Academy for Methodology, Analytics and Psychometrics (MAP Academy) and the Nebraska Department of Education’s Data Management and Application Development (DMAD) team.
For this specific collection, school systems are asked to enter data related to special education teachers who left their positions, along with a specific reason for their departure. The data is collected annually each spring for the previous school year. For example, the spring 2025 data collection reflects retention and movement of special education teachers at the end of the 2023-24 school year.
DATA ANALYSIS
One-year teacher retention data were quantitatively summarized using descriptive statistics (e.g., mean, standard deviation, frequency). The retention rate was calculated as the percentage of teachers employed in the 2023-24 school year who remained at the district in the 2024-25 school year. Retention rates were analyzed at the statewide level and further examined by region (i.e., Central, Metro, Northeast, Southeast, West Central and Western), ESU, district size (student enrollment), position (IDEA coding) and time in service. Frequencies and percentages were also calculated to describe the reasons teachers left.
RETENTION CATEGORY THRESHOLDS
Data will be accessible to districts through the Nebraska Education Profile page, providing open access to retention levels. As the data years build, school systems may use the trends to reach out to their colleagues with higher retention rates and learn from their practices.
NDE, in collaboration with the GET SET Nebraska team, has identified specific retention categories to help schools monitor their progress and set special education teacher retention goals. The categories are as follows:
- Targeted — 75-100% Retained
- Approaching — 50-74% Retained
- Below Target — 0-49% Retained
NEBRASKA TEACHER VACANCY SURVEY
STATEWIDE SPECIAL EDUCATION RETENTION DATA SYSTEM
The 2024 NDE Teacher Vacancy Survey report identified special education as the area with the largest shortage, accounting for 23% of unfilled positions in the state (source: NDE).
This is not a new problem. In fact, SPED teachers have accounted for the largest proportion of vacancies for at least the last five years. More than 149 special education positions remain unfilled. The majority of these vacancies are concentrated in the Metro region (Region 6), which accounts for 54% of the total unfilled positions.
It’s important to note that this annual survey focuses exclusively on unfilled positions and does not address the issue of teacher retention. Understanding retention can help schools further develop supportive practices to retain new special education teachers.
RETENTION RATES
RETENTION RATES BY REGION
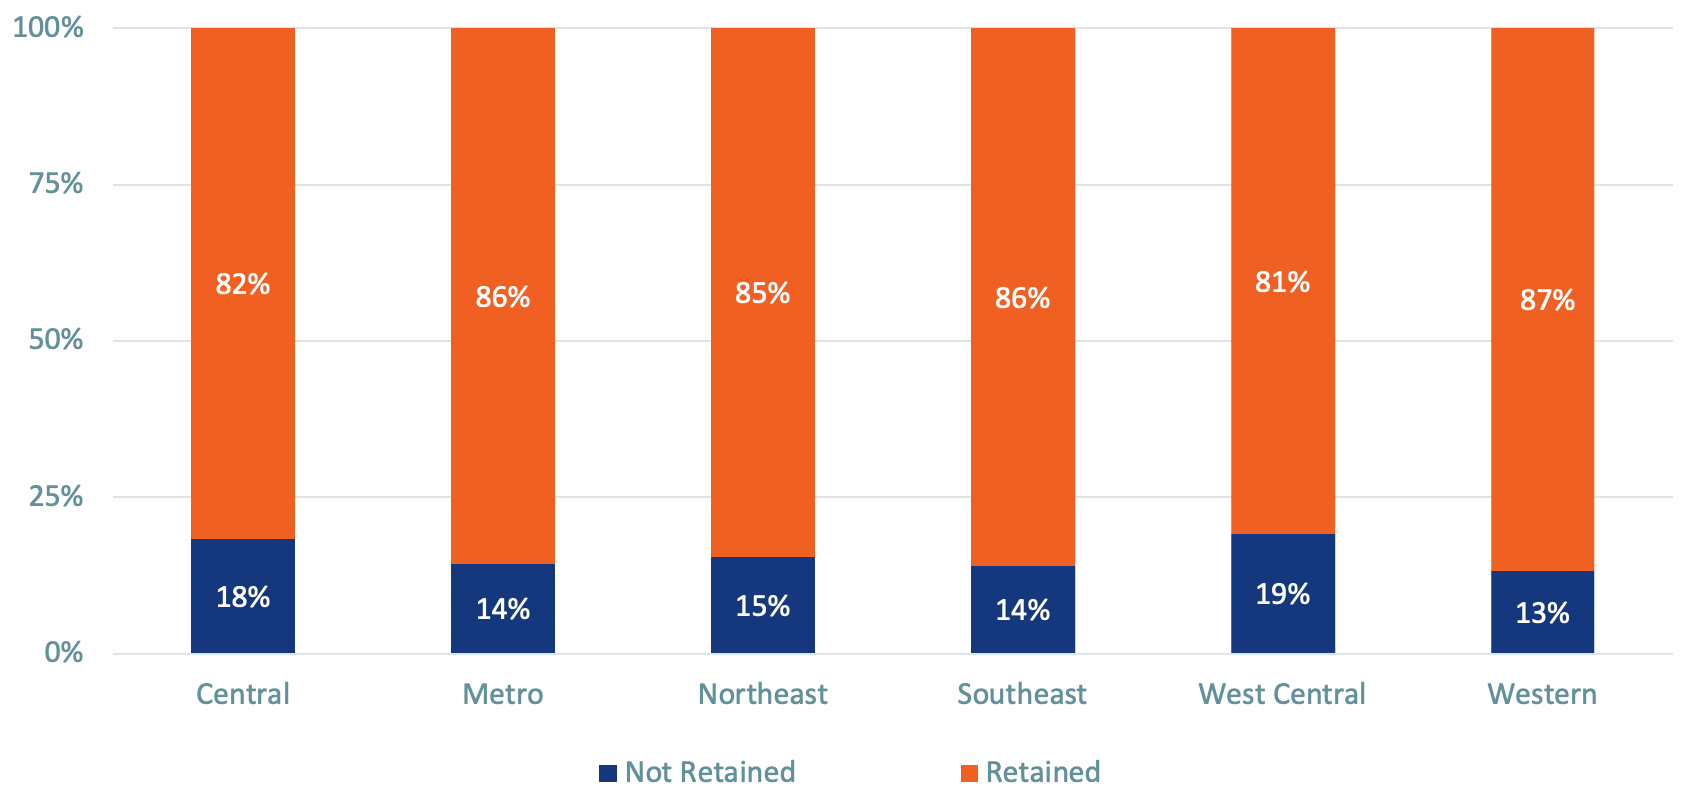
The Nebraska Teacher Vacancy Survey shows significant differences between regions related to the total number of open positions. However, when analyzing the SRDS retention rates, retention levels remain constant across regions. Similar to the 2023-24 school year retention report, the 2024-25 report revealed that retention rates for special education teachers across all regions ranged from 83% to 85% (see Figure 1). In other words, each region experienced the loss of 15-17% of their total special education teacher population.
While the number of open positions may vary throughout the state, all regions are retaining their special education teachers at similar rates. Therefore, retention rates should be viewed as a statewide issue, as no region is exempt from the challenges of special education shortages.
Figure 1
Retention Rates by Region
RETENTION RATES BY DISTRICT ENROLLMENT SIZE
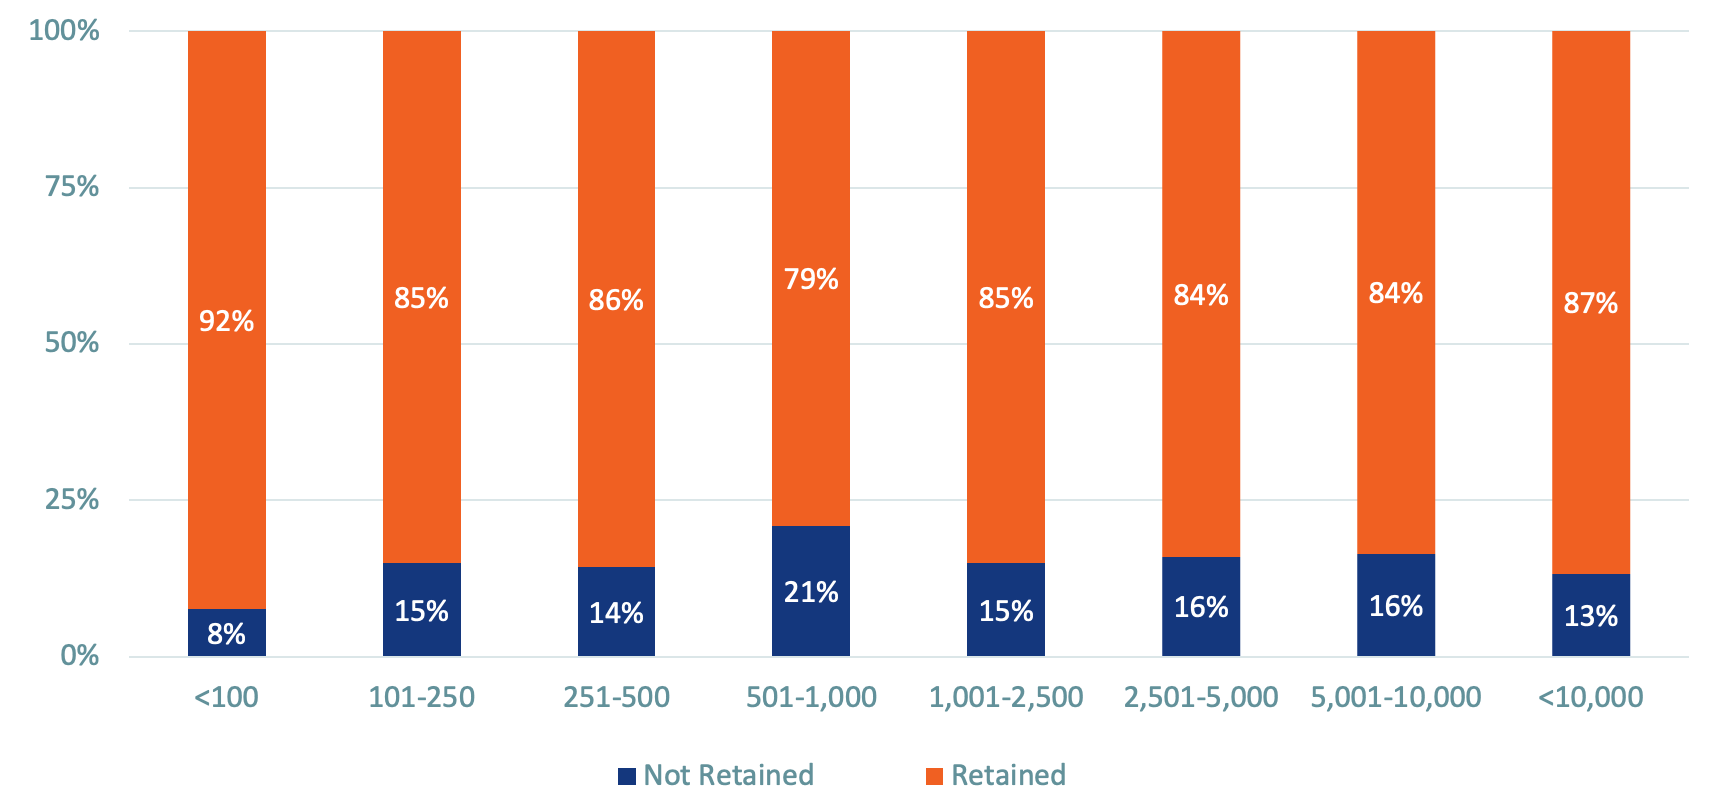
There is little difference in retention rates when comparing schools based on district enrollment size. Although a few exceptions show slight variances from the overall trend. Specifically districts with fewer than 100 students and ESUs retain teachers at a higher rate than their peers statewide, 92.3% and 94.6% respectively. Conversely, schools with 501 to 1,000 students experience a slightly lower retention rate of 79.5%. The reasons for this difference are unclear; perhaps administrative support or collegiality is stronger in smaller settings.
Figure 2
Retention Rates by District Enrollment Size
RETENTION ACROSS ESU SERVICE AREAS
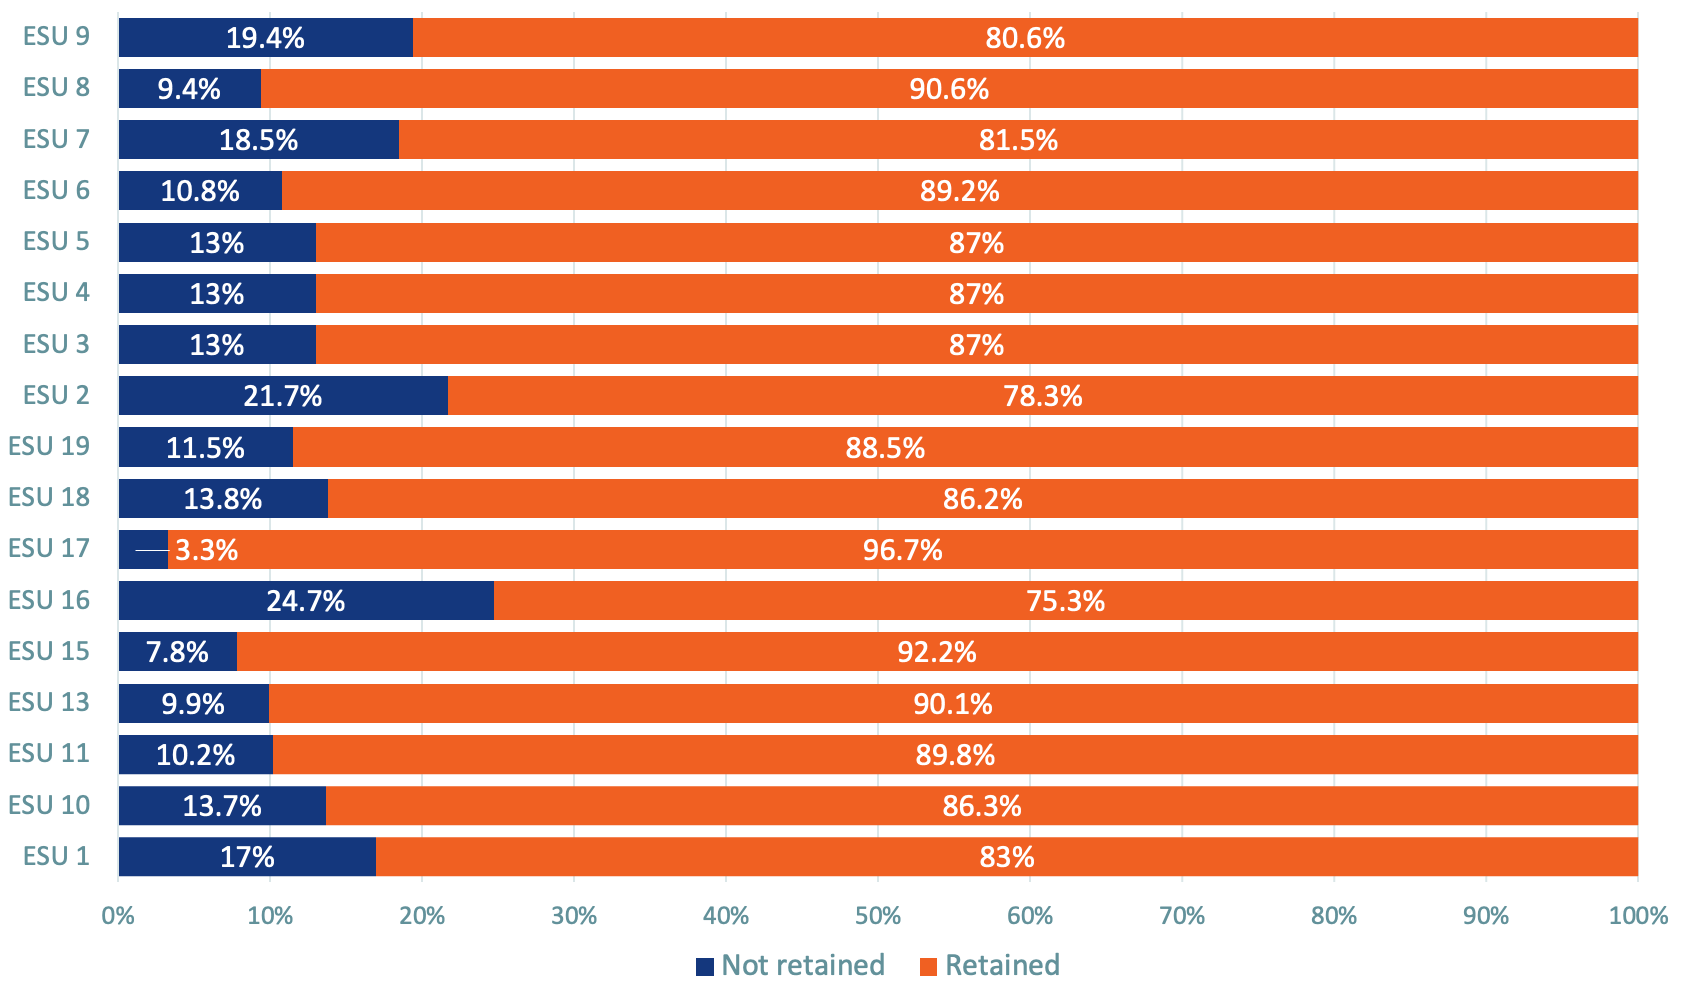
Nebraska is home to 17 ESUs, each serving different regions of the state. ESUs support the school districts within their boundaries and may help member schools with retention planning. Current findings indicate that retention rates within the ESU boundaries vary significantly, ranging from 75.3% to 96.7% (see Figure 3).
Several ESU boundary areas have reported retention rates at or above the state average of 84.9%. Notably, four ESUs recorded retention rates above 90%: ESU 13 at 90.1%, ESU 8 at 90.6%, ESU 15 at 92.2%, and ESU 17 at 96.7%. A closer examination of the data by ESU boundary regions may help identify the factors contributing to the lower retention rates in some areas.
Figure 3
Retention Rates by ESU
RETENTION BY POSITION AND TIME IN SERVICE
Position
Special education includes a variety of position codes, with students receiving services in varying settings. Some positions require specialized education and licensure, and certain specialists may serve students across regional and Educational Service Unit (ESU) boundaries due to the nature of their expertise. Additionally, positions often depend on student numbers and needs, which may shift and lead to significant differences in some specialty categories.
The current report shows that retention rates for special education roles vary, ranging from 70% to 100%. Retention rates for specialists remain generally stable, with Teachers of the Visually Impaired (school age) and Teachers of the Deaf/Hard of Hearing typically maintaining rates between 98% and 100% (see Figure 4). However, Teachers of the Visually Impaired (early childhood) are an outlier, showing a retention rate of only 57%. It is unknown why the early childhood position has a lower retention rate relative to school age. One explanation may be attributed to coding changes related to fluctuating student numbers and transitions of students into school age programs.
It is also important to note that retention rates of teachers working in resource settings and providing school-based special education support, are around 70% when compared to peers working in less inclusive settings. Administrators may want to evaluate positions to examine differences and work settings.
Time in Service
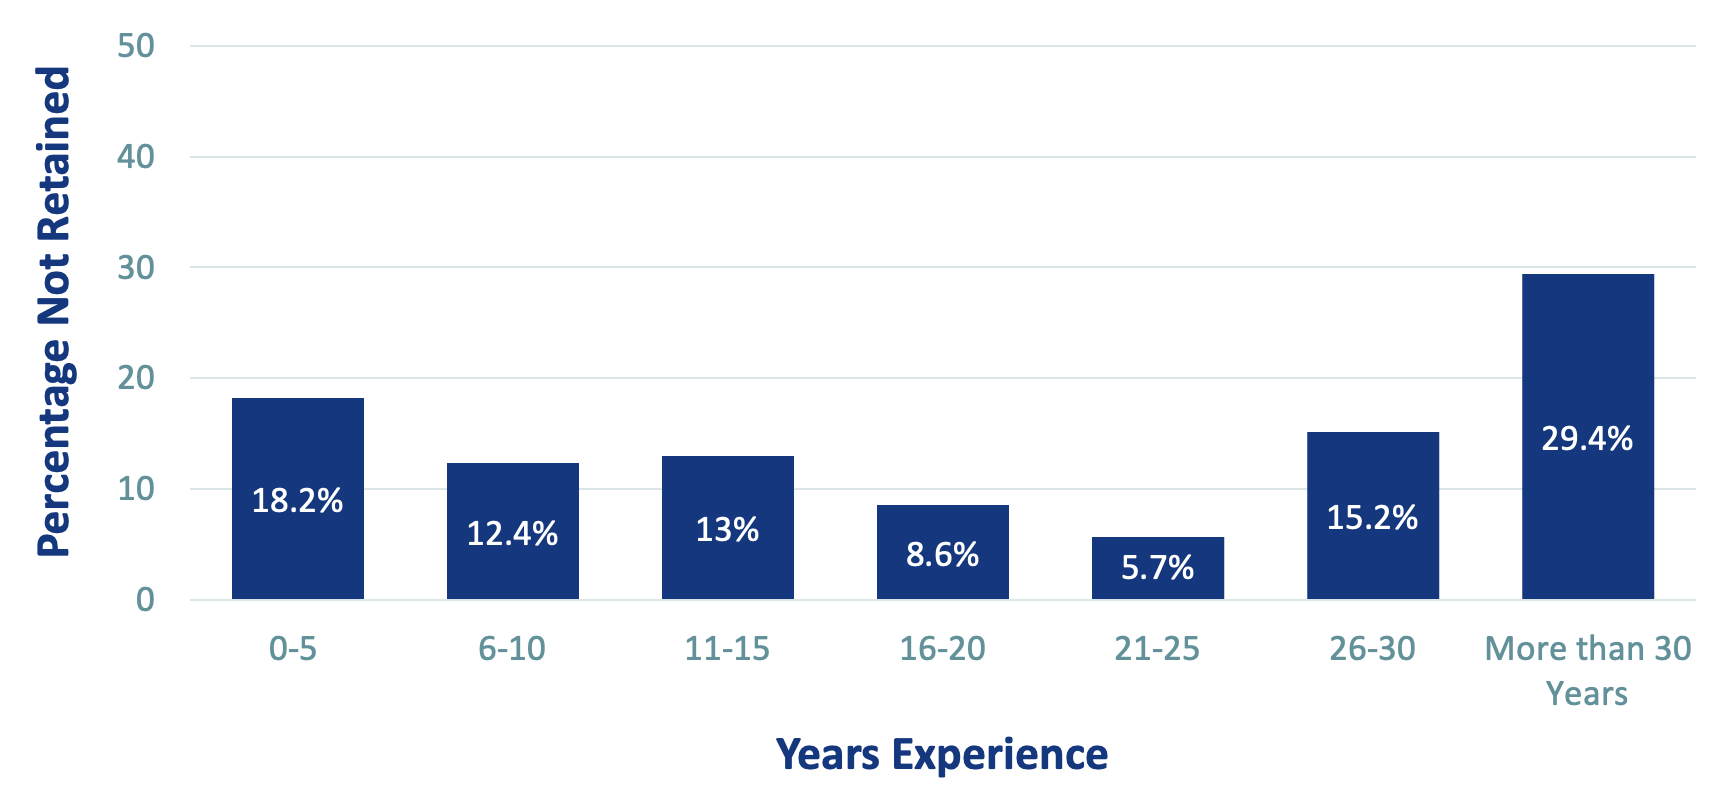
Time in service has proven to be a significant factor in teacher retention. Administrators may want to examine district data to determine if the concern is relevant to their district. The findings may guide discussions about the need for teacher leadership opportunities for long term teachers and mentoring and support opportunities for teachers with less time in service.
The SDRS indicated that 29.4% of teachers with 30 years in service or more left their districts (See Figure 5). Overall SDRS data indicates that 20% of this group left due to retirement. Retirements are often seen as an element administrators can not impact. However, when the data noted is compared, 9.4% of teachers with 30 years in service left their districts but did not retire. This could indicate a data point for administrators to consider.
Additionally, 15.2% of “leavers” had between 26 and 30 years of experience when they departed from their districts (See Figure 5). Further examination of this group could be beneficial in understanding how best to retain teachers with extensive experience and connections.
It is also noteworthy that novice teachers, those with fewer than five years of experience, are leaving at higher rates than the overall group. Specifically, 18.2% of individuals in the 0-5 year category left their schools. This loss of new teachers may contribute to the loss of enthusiasm, innovative teaching methods, and fresh ideas.
Figure 4
SPED Teacher Retention Rate by Position
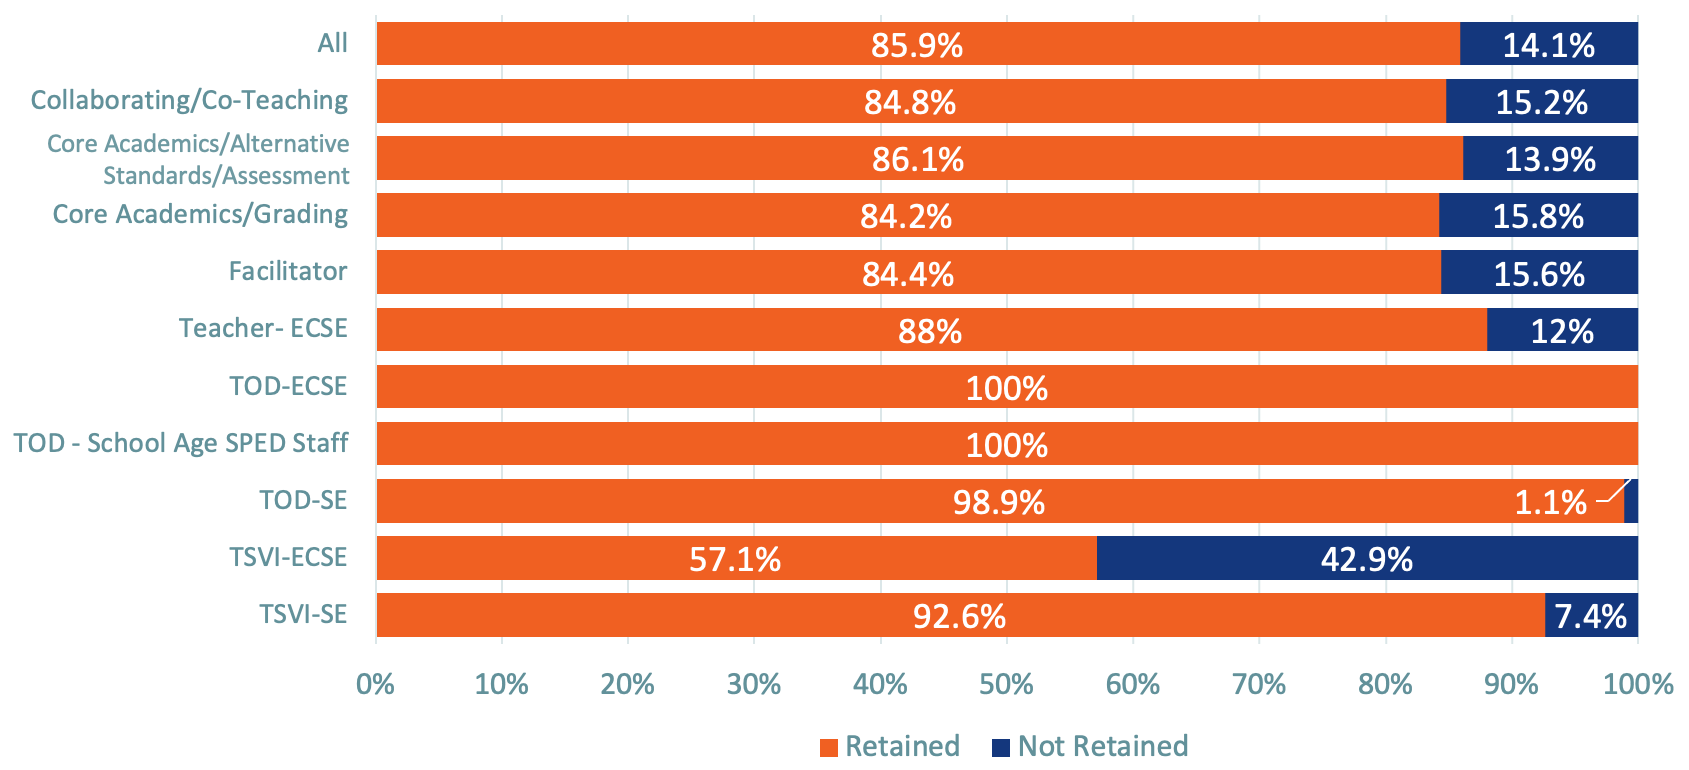
Figure 5
Retention Based on Year of Experience
REASONS TEACHER LEAVE
By documenting the reasons teachers resign, districts can identify actionable steps for improvement. The DCS specifically requested that districts provide reasons for teacher attrition. Understanding why teachers leave a district is crucial for schools and districts to effectively address turnover.
OVERALL REASONS
School systems were asked to identify and report the reasons why special education teachers left the district.
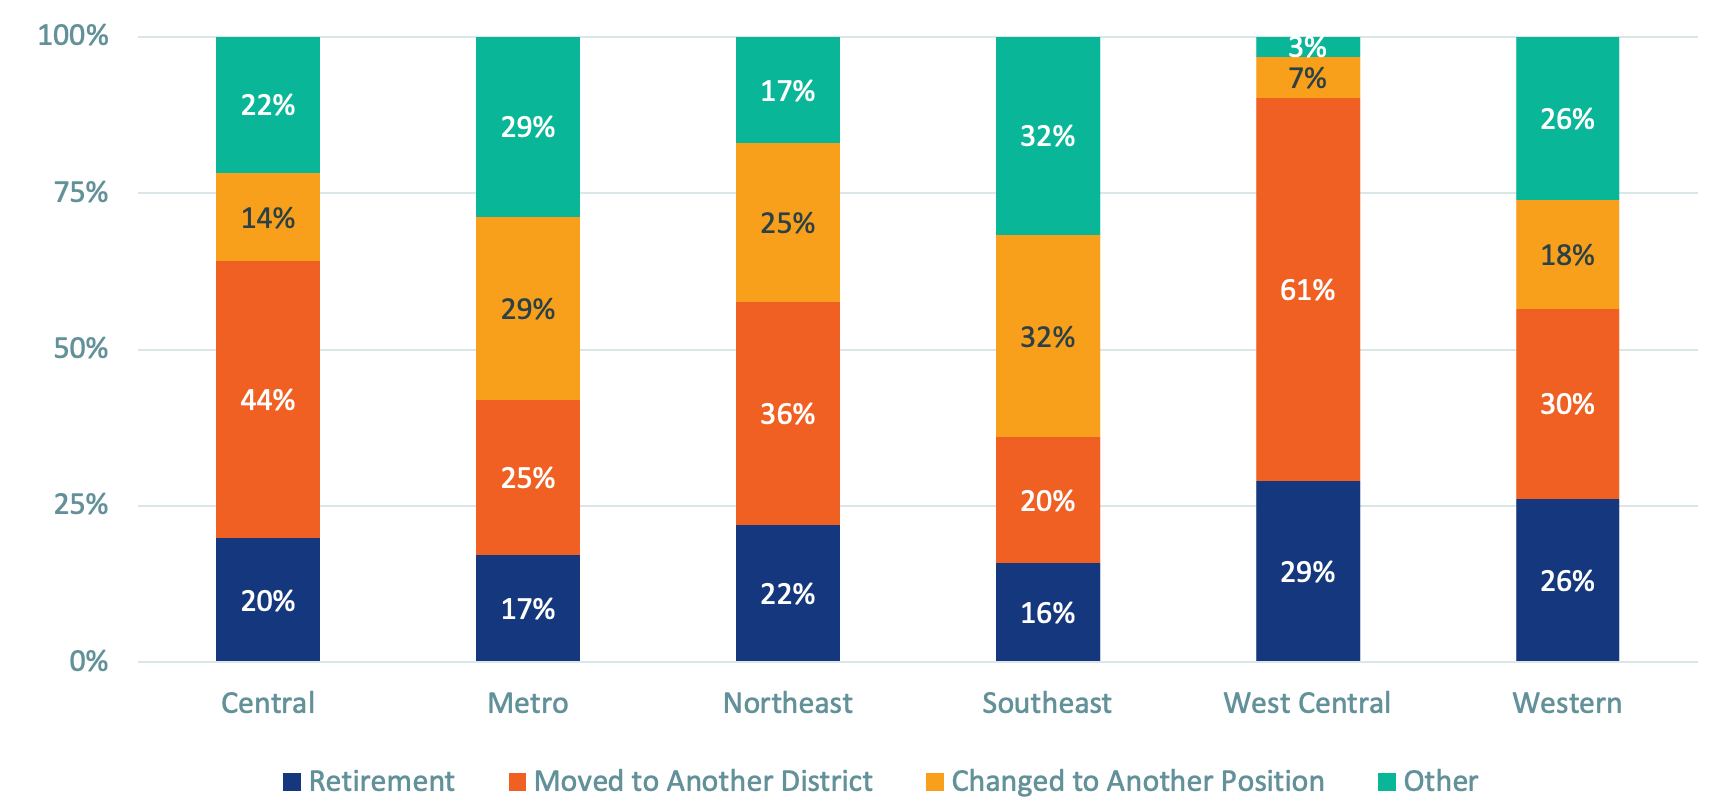
The findings from the 2025 data collection report reveal that retirement numbers are currently aligning with 2021 projections of 20%, but this is not the primary factor contributing to turnover. In fact 80%, of 537 positions, leaving for reasons other than retirement warrant further examination (See Figure 6).
Overall, the main reasons teachers leave their positions are to pursue another role within the district (23.92%) or to move to another district (29.21%). Additionally, special education teachers departed for “other” reasons such as medical leave, health concerns, family caregiving responsibilities, disciplinary issues, and budgetary constraints. Notably, 5.3% of teachers left the field of education entirely. Although regional retention rates do not vary significantly, districts may gain insights by examining the specific reasons teachers leave within their regions.
These findings may indicate that many special educators are opting for general education roles or specialized administrative or alternative positions within their schools or districts, or that they may be unhappy in their current environments. Schools should consider implementing stay or exit interviews to determine if there are significant concerns that need to be addressed.
Figure 6
Reasons Teachers Not Retained By Region
Recommendations
Special education teacher turnover can be costly for districts both financially and human capital. Experienced teachers who leave their districts take their expertise and collaborative relationships with them. The loss of these skills can negatively impact student growth. It is crucial for districts to begin retention planning.
CONSIDER THE FOLLOWING TO PROMOTE DISTRICT SPECIAL EDUCATION TEACHER RETENTION:
1. Monitor trends in state and local retention data.
Districts need to continue to evaluate their individual retention data collected through Get SET Nebraska as well as their internal data. This evaluation should not only focus on overall retention numbers but also explore regional and district causes of turnover. Administrators should analyze reasons for turnover and develop strategies to address identified needs. The Special Education Retention Data System and the Nebraska Vacancy Report are valuable data sources for understanding the statewide and regional retention landscape. By combining this information with local Human Resource data, exit interviews, and stay interviews, districts can gain a clearer picture of their special education retention status.
2. Develop a local/district data-based district retention plan.
Get SET Nebraska provides tools for administrators to create a retention plan. The Get SET Nebraska Administrative Leadership Academy (ALA) guides administrators through a structured approach to learning and reflection. Participants strategically develop their retention plans through four learning modules. Thoughtful activities and questions help focus their reflection on the components of retention planning. Administrators have the opportunity to build their retention teams and set goals to achieve their plans. Access the ALA materials.
3. Adopt a comprehensive induction and mentorship program.
When addressing concerns related to teacher retention, it’s essential to also consider future intent to stay. Although the Intent to Stay data was not included in Nebraska’s Special Education Retention Data System, it remains important when discussing retention. Strategically addressing this concern can create a stable support system for Nebraska’s students.
The Get SET Nebraska program offers three phases of support for teachers within the first three years of service to their districts, otherwise known as mentees, within their districts. Each teacher is paired with a local mentor who is well-matched to their grade level, content area, and caseload. Together, the mentor and mentee, along with their administrators, follow a mentorship plan that lasts either one or two years. During this time, they engage in guided activities designed to support the mentee’s development, supplemented with individualized professional development opportunities.
The Get SET Program is available to assist schools in addressing retention concerns and supporting teachers. The recent scale up study identified that supporting teachers with the Get SET Nebraska Induction and Mentorship Program could yield higher retention rates than teachers not receiving support. 91% of teachers supported by the program were retained for the 2024-25 school year compared to 84.8% of the comparison group not supported with the program.
Teachers who are paired with a mentor are more likely to remain in the field of special education. The Get SET Nebraska Induction and Mentoring program has shown significant positive impacts on special education teachers’ job satisfaction. Administrators can easily lead their teams through the Get SET Nebraska Induction and Mentorship (I&M) program. Access the I&M materials.
4. Plan and conduct stay interviews.
Engaging in conversations with staff is crucial for understanding their level of connection and satisfaction within a district. Establishing a structured approach, such as stay interviews, can help administrators assess staff members’ feelings. According to Education Week, stay interviews are discussions that occur during the school year with individuals whom you want to retain. The article highlights that stay interviews can result in a retention rate of up to 90%.
Stay interviews involve meaningful and intentional conversations. Not every staff member needs to be included in these interviews; administrators should identify key individuals who are essential to retain. Asking questions that explore why these employees choose to stay and what might prompt them to leave can help administrators address their needs effectively. It’s important to follow up on any issues raised during these discussions.
Administrators can visit the SHRM website to find suggested stay interview questions.
5. Think outside the box when planning positions.
Many teachers who left positions due to “other” reasons may not have control over their circumstances. Retention may not be possible for all teachers, but it is possible some of them may stay if schools think outside the box and rethink position design. Adapting and adjusting roles may be a necessity in retaining teachers. Communicating with teachers is vital to understand their needs, concerns and availability. Many may believe that full time options are their only choice.
Through conversations and stay interviews, school districts could develop targeted, individualized plans to encourage individuals to continue teaching, at least on a part-time basis. Job sharing and other options may be particularly enticing for those who leave due to family care responsibilities or extended leaves of absences. Even if the teacher stays on for 10-12 hours a week, conducts home visits, provides in home services, or provides summer extended school year services their expertise is valued. They may also be more likely to return to full time in the district.
Access the Get SET Nebraska Induction and Mentorship program web page.

