Nationwide special education teacher shortages are affecting the availability of professionals to support students. Nebraska schools are also experiencing these shortages, with state reports highlighting a significant lack of special education teachers. It’s essential to have qualified and skilled educators, which is why administrators should prioritize the retention of special education teachers.
Before the Get SET Nebraska project, schools had limited access to data regarding special education teacher shortages. The Get SET Nebraska team recognized the importance of retention data for effective district planning. Consequently, they set a goal to develop a statewide system for tracking special education shortages.
DEVELOPMENT
The statewide special education retention data system was established through a collaboration between the University of Nebraska-Lincoln’s Academy for Methodology, Analytics and Psychometrics (MAP Academy) and the Nebraska Department of Education’s Data Management and Application Development (DMAD) team.
School systems were asked to provide information on the total number of special education teachers who left their positions, as well as the reasons for their departures. Data are reported statewide through the Nebraska Education Profile page, ensuring open access to district retention levels. This transparency will allow schools to assess their retention rates effectively. School personnel entered data into the system in the spring of 2024. Entries represented special education teachers who left positions at the end of the 2022-23 school year.
DATA ANALYSIS METHOD
One-year teacher retention data were quantitatively summarized using descriptive statistics (e.g., mean, standard deviation, frequency). The retention rate was calculated as the percentage of teachers employed in the 2022-23 school year who remained at the district in the 2023-24 school year. Retention rates were analyzed at the statewide level and further examined by region (i.e., Central, Metro, Northeast, Southeast, West Central and Western), ESU, school district, district size (student enrollment), and years of teaching experience. Frequencies and percentages were also calculated to describe the reasons teachers left.
A Statewide Picture of Retention
The Nebraska Special Education Retention data collection has helped to create a picture of special education retention in the state. Like most landscapes, retention data has many important focal points. The Get SET Nebraska team wanted to provide to tell the full story of Nebraska retention and focused on the following:
- Statewide Retention and Acceptable Thresholds
- Retention by Region
- Retention by Enrollment Size
- Retention by ESU Service Area
- Retention by Position and Time in Service
RETENTION DATA
Statewide Retention
A total of 284 school systems provided data on 3,536 teachers across 4,716 special education teacher positions. Results for the 2023-2024 school year indicate that Nebraska has an overall state average of 85% retention of special education teachers. Retention rates are at or above the national level. However, despite this seemingly positive outcome, Nebraska schools still lost more than 704 teachers from their special education classrooms. The data highlights the sense of urgency and responsibility for maintaining staff.
Additionally, the 2023-24 Nebraska Department of Education (NDE) Teacher Vacancy Survey identified special education as the area with the largest shortage accounting for 23% of unfilled positions in the state. Special education teacher vacancies have been the most concerning shortage over the last three years (source).
Retention by Region
Nebraska organizes school districts into six different regions.

Nebraska Vacancy Survey (2024)
The 2023-24 Nebraska Teacher Vacancy Survey, issued by NDE, has highlighted significant shortages in special education across the state. A large majority of these unfilled positions are located within the Metro region (region 6), which accounts for 67% of the total vacancies. The annual survey focuses solely on unfilled positions and does not address teacher retention, which can inform schools of supportive new career special education teacher retention practices.
To evaluate retention across regions, data from the Nebraska Special Education Teacher Shortage data collection were analyzed. The findings revealed that retention rates for special education teachers across all regions ranged from 83-85% (see Figure 1 for retention rates by region), with no significant differences noted among the regions. While the number of open positions may vary throughout the state, all regions are retaining their special education teachers at similar rates. Therefore, retention rates should be viewed as a statewide issue, as no region is exempt from the challenges of special education shortages.
Figure 1
Retention Rates by Region
Retention Rates by District Enrollment Size
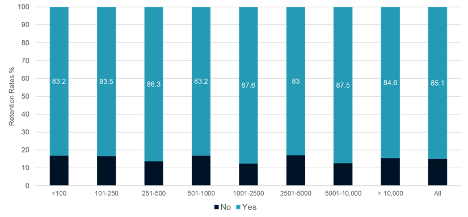
A similar trend emerged when examining retention based on the size of district enrollment. Minimal to no difference in retention rates was observed based on district enrollment size (see Figure 2). When reviewing the state vacancy information, it becomes evident that retention is a concern across all sizes of districts.
Figure 2
Retention Rates by District Enrollment Size

Retention Rates Across ESU Service Areas
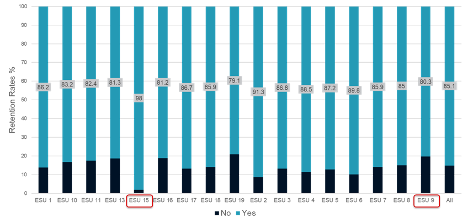
Nebraska is home to 17 Educational Service Units (ESUs), each serving different regions of the state. A further analysis was conducted to examine retention rates within these ESU boundaries. Most of the ESUs saw retention rates in the 80-90% range (see Figure 3), with two exceptions. Notably, ESU 15 achieved a retention rate of 98%, while ESU 9 had a rate of 91.3%, both of which are above the state average.
Figure 3
Retention Rates by ESU
Retention by Position and Time in Service
Special education encompasses a variety of position codes, with students receiving services in diverse settings. Job requirements vary across these positions. Data collected indicates that retention rates across all roles remain relatively stable, with the retention of Teachers of the Visually Impaired (school age) and Teachers of the Deaf/Hard of Hearing ranging from 98-100% (see figure 4 for sped teacher retention rates by position). No significant differences were observed among other positions.
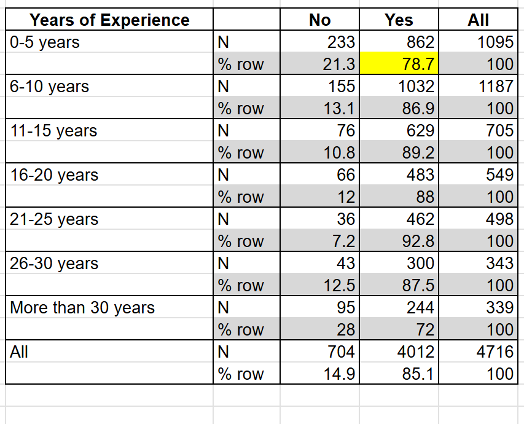
Years of experience emerged as an important factor in retention. Notably, 28% of those leaving their positions had more than 30 years of service, and retirement likely accounts for many of these departures (see Table 1 for retention based on years of experience). However, a significant proportion of teachers who departed, 21.3%, were within their first five years of employment.
These findings suggest that particular support and attention may be needed to retain new special education teachers. The retention by position and time in service data can inform schools of supportive practices to retain newly hired special education teachers.
Figure 4
Sped Teacher Retention Rates by Position
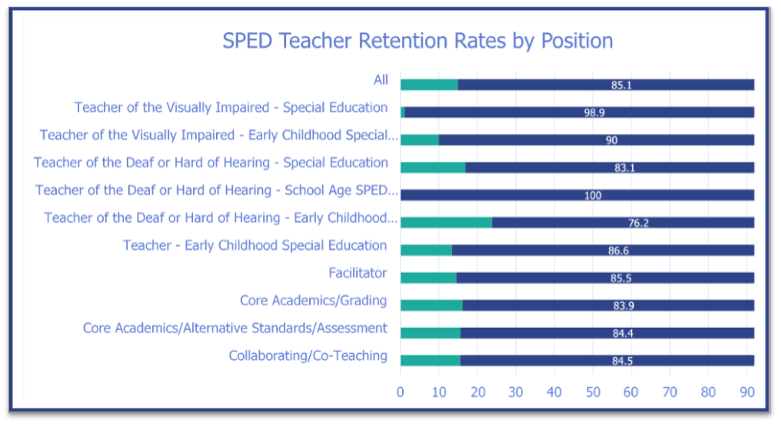
Table 1
Retention Based on Years of Experience
Reasons Teachers Leave
Data regarding retention levels is essential for understanding the shortage of special education teachers. Documenting why teachers leave can help districts identify actionable steps for improvement. The Nebraska Special Education Retention Data System specifically asked districts to provide reasons for teacher attrition. This information can be beneficial for schools as they develop strategies to address retention issues.
OVERALL REASONS
School systems were asked to identify and report why special education teachers resigned. Understanding why teachers leave a district enables schools and districts to effectively address turnover.
Data from 2021 indicated that 22% of special education teachers would be eligible for retirement within three years. However, findings from the 2024 data collection reveal that retirement is not the primary reason for retention concerns. Instead, the main reasons teachers leave a position are to pursue another position within the district (17%) or move to another district (33%). Additionally, special education teachers left their districts due to a leave of absence, health concerns, family care responsibilities, disciplinary issues and budgetary needs.
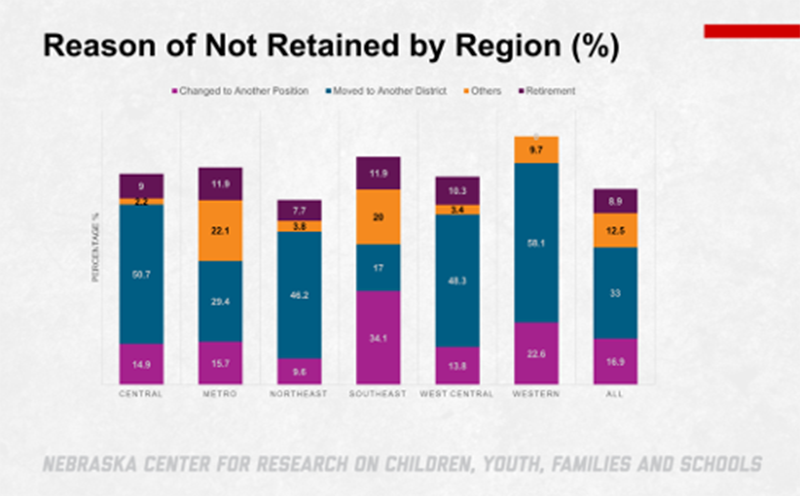
Get SET Nebraska evaluated data regionally, and the data suggests there are regional differences regarding reasons for leaving. For example, if a school or district is within the Southeast region (see Figure 6 related to regional reasons for not retaining staff), they may notice 34% of special education teachers left their special education teacher positions for different positions within their current school. This could indicate that many special educators are opting for general education positions or specialized administrative or alternative positions within the school or district. Likewise, a school or district in the Western region (see Figure 6 related to regional reasons for not retaining staff) may pay particular attention to teachers who moved to another district (58.1%). Understanding the detailed information related to regional transitions can help districts address internal and external barriers for special education teachers
Figure 5
Reasons Teachers Not Retained
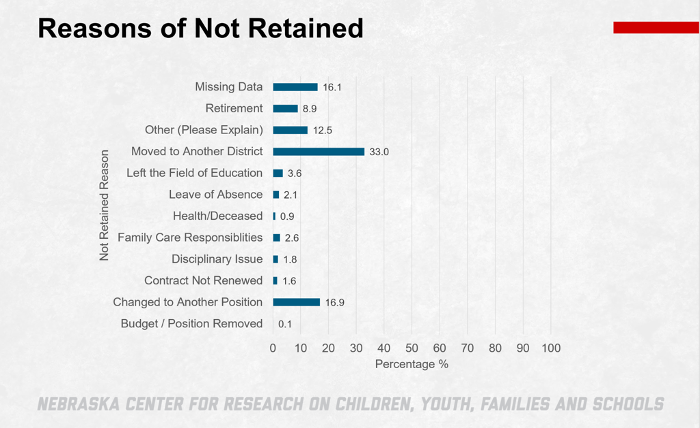
***16.1% of respondents did not include reasons and 12.5% included reasons which could not be classified.
Figure 6
Reasons Teachers Not Retained by Region
Recommendations
Although Nebraska is at or above the national average, 704 special education positions (15%) were not retained. It is crucial for districts to begin discussions about retaining qualified special education teachers. Schools are not alone in facing the challenges of special education teacher shortages.
The Get SET Nebraska is available to assist schools in addressing retention concerns and supporting teachers. Data collected from the 2023-24 scale-up study suggests that teachers supported by the program are more likely to remain in their positions compared to those not supported by the program.
RECOMMENDATIONS TO PROMOTE DISTRICT RETENTION GROWTH:
1. Review State and Local Retention Data
Districts need to evaluate their individual retention data collected through Get SET Nebraska, as well as their internal data. This evaluation should not only focus on overall retention numbers but also explore the regional causes of turnover. Administrators should analyze these reasons for turnover and develop strategies to address identified needs. The Special Education Retention Data System and the Nebraska Vacancy Report are valuable resources for understanding the statewide and regional situation. By combining this information with local human resource data, exit interviews, and stay interviews, districts can gain a clearer and nuanced picture of their special education retention status.
2. Develop a District Retention Plan
Accredited schools in Nebraska are required to plan and implement a Continuous Improvement plan. The Get SET Nebraska program can be included as part of the district’s professional development and retention planning. Effective planning includes learning about retention, developing a plan and monitoring data.
The program’s Administrative Leadership Academy (ALA) guides administrators through a structured approach to learning and reflection. Participants strategically develop their retention plans through four learning modules. Thoughtful activities and questions help focus their reflection on the components of retention planning. Administrators have the opportunity to build their retention teams and set goals to achieve their plans. Access the materials here: Administrative Leadership Academy.
The program also leads teams through a process of evaluating action steps. Districts can use multiple sources of internal and external data in the evaluation process. Internal data is collected as a part of the Get SET Nebraska retention planning process. Outcome data could be monitored through the Special Education Retention Collection and also in perceptual surveys (e.g., teacher job satisfaction, teacher job stress).
3. Support Early Career Teachers with the Get SET Nebraska Induction and Mentorship Program
When addressing concerns related to teacher retention, it’s essential to also consider future intent to stay. Although the Intent to Stay data was not included in Nebraska’s Special Education Retention Data System, it remains important when discussing retention. Strategically addressing this concern can create a stable support system for Nebraska’s students.
The Get SET data team examined whether the Get SET Nebraska program could influence teachers’ future intent to stay as part of the 2023-24 scale-up study. When asked about their intentions regarding how long they plan to stay in the field, 61% of the treatment group (who were supported by the program) indicated they would like to remain as long as possible, compared to 43% in the comparison group (those not supported by the program). This data is promising and may suggest a connection between the desire to stay and the support provided by the Get SET Nebraska program.
Teachers who are paired with a mentor are more likely to remain in the special education field. The Get SET Nebraska Induction and Mentorship (I&M) program has shown significant positive impacts on special education teachers’ job satisfaction. Administrators can easily lead their teams through the I&M program. Access the materials here: Induction and Mentorship program.

